The problems that I have with p-values and NHST are not minor quibbles. They unfortunately cut to the core of scientific practice. They affect the quality of reported and published scientific evidence, they perturb in major ways the process of accumulation of knowledge and eventually they might undermine the very credibility of our scientific results.
I can see two major detrimental consequences to the use of p-values and NHST:
- Publication bias: published results overestimate the true effects, by a large margin, with published results being 1.5 to 2 times larger than the true effects on average.
- Imprecision: published results have low precision, with a median signal to noise ratio of 0.26.
Publication bias
This means that if the true effect is nonexistent, only positive and negative studies showing that it exists and is large will be published. We will get either conflicting results or, if researchers favor one direction of the effect, we might end up with evidence for an effect that is not there.
There are actually different ways publication bias can be generated:
- Teams of researchers compete for publication based on independent samples from the same population. If 100 teams compete, on average, 5 of them will find significant results even if the true effect is non-existent. Depending on the proportion of true effects that there is to discover, it might imply that most published research findings are false.
- Specification search is another way a team can generate statistically significant results. For example, by choosing to stop collecting new results once the desired significance is reached, choosing to add control variables or changing the functional form. This does not have to be conscious fraud, but simply a result of the multiple degrees of freedom that researchers have, which generate what Andrew Gelman and Eric Loken call "the garden of forking paths." In a pathbreaking paper in psychology, Joseph Simmons, Leif Nelson and Uri Simonsohn showed that leveraging on degrees of freedom in research, it is very easy to obtain any type of result, even that listening to a given song decreases people's age.
- Conflicts of interest, such as in medical sciences where labs have to show efficiency of drugs, might generate a file drawer problem, where insignificant or negative results do not get published.
Evidence of publication bias from replications
Replications consists in trying to conduct a study similar to a published one, but on a larger sample, in order to increase precision and decrease sampling noise. After the replication crisis erupted in their field, psychologists decided to conduct replication studies. The Open Science Collaboration published in Science in 2015 the results of 100 replication attempts. What they found was nothing short of devastating (my emphasis):
The mean effect size (r) of the replication effects (Mr = 0.197, SD = 0.257) was half the magnitude of the mean effect size of the original effects (Mr = 0.403, SD = 0.188), representing a substantial decline. Ninety-seven percent of original studies had significant results (P < .05). Thirty-six percent of replications had significant results; 47% of original effect sizes were in the 95% confidence interval of the replication effect size.Here is a beautiful graph summarizing the terrible results of the study:

It seems that classical results in psychology such as priming and ego depletion do not replicate well, at least under some forms. The replication of the ego depletion original study was a so-called multi-lab study where several labs ran a similar protocol and gathered their results. Here is the beautiful graph summarizing the results of the multi-lab replication with the original result on top:

What about replication in economics? Well, there are several types of replications that you can run in economics. First, for Randomized Controlled Trials (RCTs), either run in the lab or in the field, you can, as in psychology, run another set of experiments similar to the original. Colin Camerer and some colleagues did just that for 11 experimental results. Their results were published in science in 2016 (emphasis is mine):
We find a significant effect in the same direction as the original study for 11 replications (61%); on average the replicated effect size is 66% of the original.So, experimental economics suffers from some degree of publication bias as well, although apparently slightly smaller than in psychology. Note however that the number of replications attempted is much smaller in economics, so that things may get worse with more precision.
I am not aware of any replication in economics of the results of field experiments, but I'd be glad to update the post after being pointed to studies that I'm unaware of.
Other types of replication concerns non experimental studies. In that case, replication could mean trying to replicate the same analysis with the same data, in search of a coding error or of debatable modeling choices. What I have in mind would rather be trying to replicate a result by looking for it either with another method or in different data. In my own work, we are conducting a study using DID and another study using a discontinuity design in order to cross check our results. I am not aware of intents to summarize the results of such replications, if they have been conducted. Apart from when it is reported in the same paper, I am not aware of researchers trying to actively replicate the results of quasi-experimental studies with another method. Again, it might be that my knowledge of the literature is wanting.
Evidence of publication bias from meta-analysis
Meta-analysis are analysis that regroup the results of all the studies reporting measurements of a similar effect. The graph just above stemming from the multi-lab ego-depletion study is a classical meta-analysis graph. In the bottom, it presents the average effect taken over studies, weighted by the precision of each study. What is nice about this average effect is that it is not affected by publication bias, since the results of all studies are presented. In order to guarantee that there is no selective publication, authors of the multi-lab study preregistered all their experiments and committed to communicate the results of all of them.
But absent a replication study with pre-registration, estimates stemming from the literature might be affected by publication bias, and the weighted average of the published impacts might overestimate the true impact. How can we detect whether it is the case or not?
There are several ways to detect publication bias using meta-analysis. One approach is to look for bumps in the distribution of p-values or of test statistics around the conventional significance thresholds of 0.05 or 1.96. If we see an excess mass above the significance threshold, that would be a clear sign of missing studies with insignificant results, or of specification search transforming p-values from 0.06 into 0.05. Abel Brodeur, Mathias Lé, Marc Sangnier and Yanos Zylberberg plot the t-statistics for all empirical papers published in top journals in economics between 2005 and 2011:

The most classical approach to detect publication bias using meta-analysis is to draw a funnel plot. A funnel plot is a graph that relates the size of the estimated effect to its precision (e.g. its standard deviation). As publication bias is more likely to happen with imprecise results, a deficit of small imprecise results is indicative of publication bias. The first of the three plots below on the left shows a regular funnel plot, where the distribution of results is symmetric around the most precise effect (ISIS-2). The two other plots are irregular, showing clear holes at the bottom and to the right of the most precise effect, precisely where imprecise small results should be in the absence of publication bias.


More rigorous tests can supplement the eyeball examination of the funnel plot. For examples, one can regress the effect size on precision or on sampling noise. A precisely estimated nonzero correlation would signal publication bias. Isaiah Andrews and Maximilian Kasy extend these types of tests to more general settings and apply them to the literature on the impact of the minimum wage on employment, and find, as previous meta-analysis already did, evidence of some publication bias in favor of a negative employment effect of the minimum wage.
Another approach to the detection of publication bias in meta-analysis is to compare the most precise effects to the less precise ones. If there is publication bias, the most precise effects should be closer to the truth and smaller than the less precise effects, which would give an indication of the magnitude of publication bias. In a recent paper, John Ioannidis, T. D. Stanley and Hristos Doucouliagos estimate the size of publication bias for:
159 empirical economics literatures that draw upon 64,076 estimates of economic parameters reported in more than 6,700 empirical studies.They find that (emphasis is mine):
a simple weighted average of those reported results that are adequately powered (power ≥ 80%) reveals that nearly 80% of the reported effects in these empirical economics literatures are exaggerated; typically, by a factor of two and with one‐third inflated by a factor of four or more.
Still another approach is to draw a p-curve, a plot of the distribution of statistically significant p-values, as proposed by Joseph Simmons, Leif Nelson and Uri Simosohn. The idea of p-curving is that if there is a real effect, the distribution of significant p-values should lean towards small values, because they are much more likely than large values close to the 5% significance threshold. Remember the following plot from my previous post on significance testing:

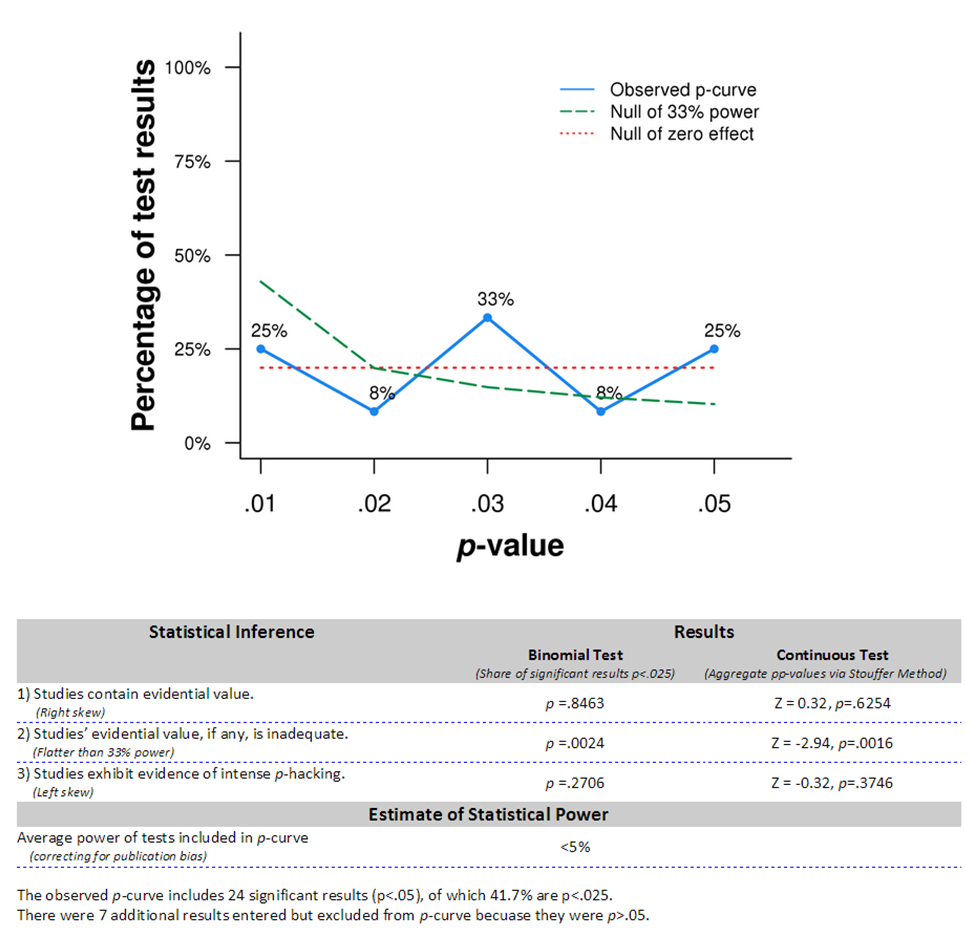
The flat p-curve suggests that there probably is no real effect of power pose, at least on hormone levels, which has also been confirmed by a failed replication. Results from a more recent p-curve study of Power Pose claims evidence of real effects, but Simmons and Simosohn have raised serious doubts about the study.
There is to my knowledge no application of p-curving to empirical results in economics.
Underpowered studies
The problem with this approach is that it focuses on p-values and test statistics and not on precision or sampling noise. As a result, the results obtained using classical power analysis are not very precise. One can actually show that the corresponding signal to noise ratio is equal to 0.71, meaning that noise is still 25% bigger than signal.
With power analysis, there is no incentive to collect precise estimates by using large samples. As a consequence, the precision of results published in the behavioral sciences has not increased over time. Here is a plot of the power to detect small effect sizes (Cohen's d=0.2) for 44 reviews of papers published in journals in the social and behavioral sciences between 1960 and 2011 collected by Paul Smaldino and Richard McElreath:

There is not only very low power (mean=0.24) but also no increase over time in power, and thus no increase in precision. Note also that the figure shows that the actual realized power is much smaller than the postulated 80%. This might be because no adequate power analysis was conducted in order to help select the sample size for these studies, or because the authors selected medium or large effects as their minimum detectable effects. Whether we should expect small, medium or large effects in the social sciences depends on the type of treatment. But small effects are already pretty big: they are as large as 20% of the standard deviation of the outcome under study.
No comments:
Post a Comment